For the last 5 days we have been working on a data visualization project with guidance from shawn and david. The aim of the project was to choose a UNdata set and develop it into visual representation using flash. We wanted to create a program that would allow us to explore the data, learn from it and raise questions that we could research further.
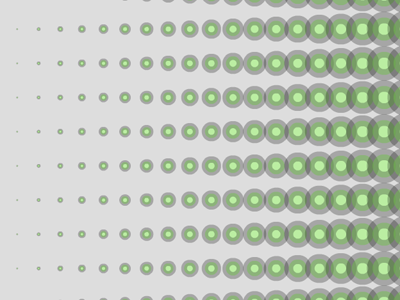
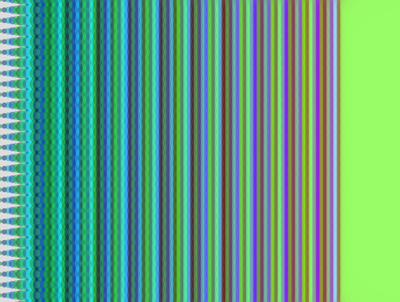
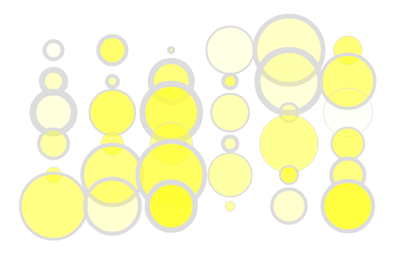
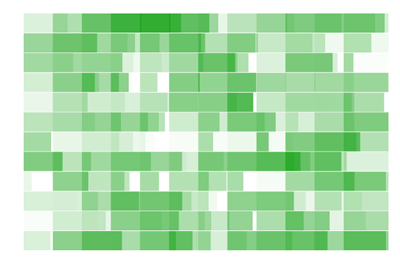
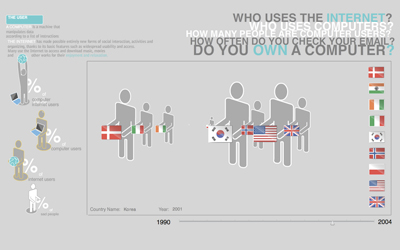
Myself and Sid (my partner for the project) decided to choose two sets of data to compare…these were the use of internet (per 100) and the use of personal computers (per 100) we narrowed our data set down to ten counties across 15 years. We represented our data using very visual icons, that we felt people could relate to and familiar with. We created two filters so you could either sort by specific countries or by different levels of computer/internet usage….The design was fully programed using actionscript and working…but her are some screen shots of our visualization. (i’m not sure how to get a swf on wordpress!!)
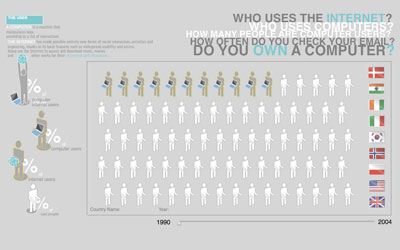
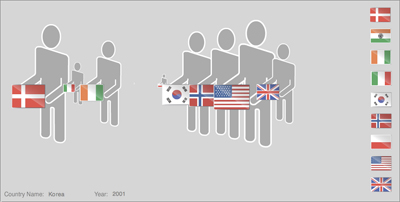
each man representing 1% of population

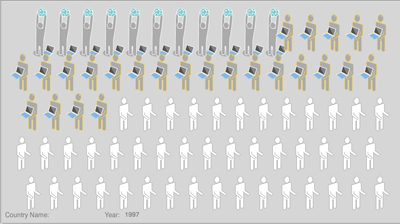
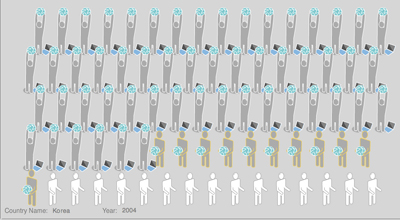
symbols scaling depending on internet/computer usage
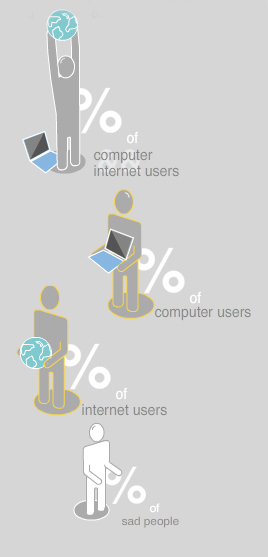 different symbols for filters
By being able to play around and see the data vizualy it was amazing to see the data come to life and see patterns and unexpected occurances. A few very important points that we learnt from our critique were……. always remember the usability of your interface, how will people understand it if is there first time using it….Being able to compare different sets of data on one page is great for comparisons……….always remember to display all the basic information before going deeper.
The last week has been great…….i am really happy that we were given this opportunity to learn flash…it felt very worthwhile. Flash seems like a very powerful tool especially when it comes to design interactive screen based designs.
